Empowering your decision-making with Power BI
Power BI is a powerful business intelligence tool that allows users to connect to a wide variety of data sources, transform and clean that data, create visually stunning reports and dashboards, and share those reports and dashboards with others. In this Article post, we’ll look at some of the key features of Power BI and how they can be used to gain insights and make data-driven decisions.
One of the key features of Power BI is its ability to connect to a wide variety of data sources. This includes common data sources like Excel, SQL Server, and SharePoint, as well as cloud-based data sources like Azure SQL Database, Dynamics 365, and Salesforce. With Power BI’s “Get Data” feature, users can easily connect to these data sources and begin working with the data.
Once connected to a data source, Power BI allows users to transform and clean the data using its “Power Query” feature. Power Query is an incredibly powerful tool that allows users to easily filter, reshape, and aggregate data. This makes it easy to clean and prepare data for analysis, even when working with large or complex data sets.
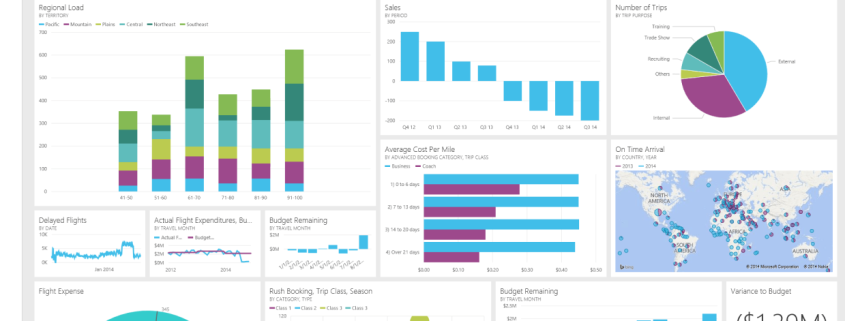
After the data has been cleaned and transformed, it can be used to create visually stunning reports and dashboards with Power BI’s “Power View” feature. Power View allows users to create charts, tables, and other visualizations to represent the data in an easily digestible format. It also includes a “drag-and-drop” interface that makes it easy to create and customize visualizations.
One of the most important aspects of Power BI is its ability to share the created reports and dashboards with others. It can be shared on the web, embedded in an application, or sent via email. The Dashboard can also be created in collaboration with other team members. By sharing reports and dashboards, decision-makers can easily collaborate on data-driven decisions and stay informed about key metrics and trends.
Another important feature of Power BI is its ability to create custom calculations and measures using DAX(Data Analysis Expressions). DAX is a formula language that allows you to create custom calculations and aggregations that can be used in your reports and dashboards. This can be particularly useful when working with complex data sets or when trying to answer specific business questions.
Power BI also has several built-in visualizations, like Bar charts, Line charts, Pie charts, and many more. But, in addition to the built-in visualizations, Power BI also allows you to create custom visuals using R or Python. This can be particularly useful when working with complex data sets or when trying to answer specific business questions.
One of the most important aspects of Power BI is its integration with the Microsoft stack. With Power BI, you can easily connect to other tools like Excel, SharePoint, and PowerApps, which can make it an ideal solution for organizations that are already using other Microsoft tools. Power BI also supports integration with Azure services such as Azure Machine Learning, Azure Stream Analytics, and many more. This allows you to build more powerful, data-driven applications and workflows.
Power BI also has a feature of live streaming, called Power BI Streaming dataset, this allows you to send real-time data updates to a dashboard, which can be useful for monitoring live data streams such as social media data or IoT data. This can be helpful when you are trying to monitor your business in real time.
Lastly, Power BI also includes robust security and data governance capabilities that enable organizations to manage access to data and secure their reports and dashboards. It also provides the capability of Row-level security, where you can restrict data access to certain users or groups.
In conclusion, Power BI is a powerful and versatile business intelligence tool that provides a range of features that allow you to connect to and analyze data, create visually stunning reports and dashboards, and share those reports and dashboards with others. With its ability to connect to a wide variety of data sources, perform custom calculations and aggregations, create custom visuals, and integrate with other Microsoft tools and services, Power BI is an ideal solution for organizations looking to gain insights and make data-driven decisions.
You can contact us now, so we can commence your business optimization with Power Automate or any of our Microsoft products.
